⚡ Quick Specs: K-Cup Production Cost Per Unit
| Production Scale | Daily Volume | Estimated COGS/Cup |
|---|---|---|
| Startup (manual / semi-auto) | < 500/day | $0.35 – $0.55 |
| Mid-scale (fully automatic) | 500 – 5,000/day | $0.18 – $0.28 |
| Commercial (high-speed linear) | 5,000 – 50,000/day | $0.10 – $0.18 |
| Enterprise (rotary line) | 50,000+/day | $0.08 – $0.14 |
COGS = materials + machine depreciation + labor + overhead. Coffee bean grade dominates the other input costs in variable volume. 2025 arabica spot prices >$4.30/lb increase coffee fill at the most brands by 35-70 percent for brands sourcing on the spot market.
Step inside any coffee equipment trade show and your will hear the same question over and over again at every machine demo: “What does it actually cost me per cup?” Vendors usually respond :Materials, maybe depreciation and cut straight to the retail margin calculations. To build a real, sustainable business you need you COGS per K-cup, which is driven by four separate, multiplying layers, any of which, in its absence, will distort your model by 30-60 percent.
This article will construct all four layers independently: materials costs at three purchase volumes, machine depreciation per utilization rate, labor and nitrogen flushing overhead, economy of scale at five volume tiers, and a co-packing comparison with actual breakeven calculations. For anyone weighing the cost feasibility of launching into their own K-cup facility, consider this article as the math foundation.
What Does It Actually Cost to Produce One K-Cup?
Every K-cup produced requires four layers of materials, machine depreciation, labor, and overhead. Indepth, discrete learning of each category is the only solution for a sustainable modeling structure.
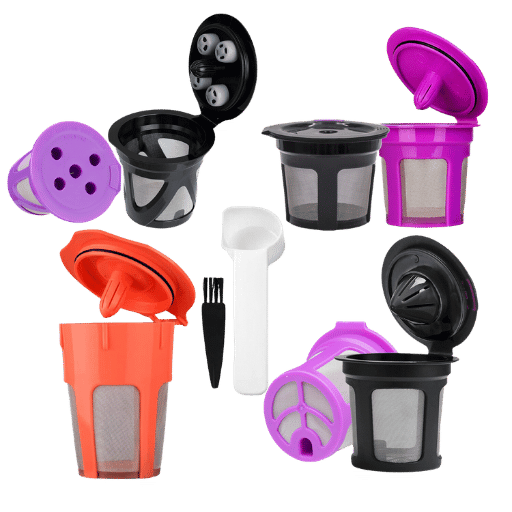
- Materials – cup shell, foil lid, filter, and coffee fill – form the largest, most variable input cost layer, scaling predictably according to purchase volume through MOQ tiers.
- Machine depreciation amortizes your equipment investment over every K-cup produced. Cost-per-cup it runs below industry standard expectations, however, the initial capital expense remains as large and real as it hits your operating budget.
- Labor costs depend primarily on your line’s relative CPM (cups/minute). What is the top per-unit labor difference: from a 40 CPM to a 200 CPM line? About 10.
- Overhead – nitrogen and electric expenses, consumables, machine maintenance, reject-rate coefficient – is almost always the biggest, under-budgeted category for first-time producers entering the format.
K-Cups are consumer packaged goods, retailing in the $0.50-$1.50 range…while in plant production costs run from around $0.10-$0.55 per cup, dependent on scale, bean grade, and channel margin costs baked into retail pricing: cost-per-unit/kg ratio represents the business viability of any K-Cup offering.
How much does it cost to make a K-Cup pod from scratch?
At typical startup scale (500 or less cups/day), the blended-in production cost per unit averages $0.35-$0.55, the components averaging out approximately as follows –materials $0.12-$0.20, machine depreciation $0.08-$0.15 (driving that usage rate downward), labor $0.08-$0.12, overhead $0.04-$0.08. A key determinant of this range: bean grade. Commodity-grade commercial blends keep the coffee fill down at around $0.05-$0.07 per cup, while specialty grade or single origin coffee at $8-$15/lb drive your fill all the way up to around $0.18-$0.33 per cup.
📋 Scenario: Portland Specialty Roaster, 2,000 Cups/Day
A Portland specialty roaster had been co-packing 2000 K-cups/day for 18 months at $0.28/cup. monthly co-packing bill: $14,000. They asked what volume would make in-house cleaning worth it, and how many months before machine payback? The math falls out in the scale economics section below—but the first step is understanding what each layer of cost contributes at that volume level:
Materials Cost Breakdown — The Four Physical Components
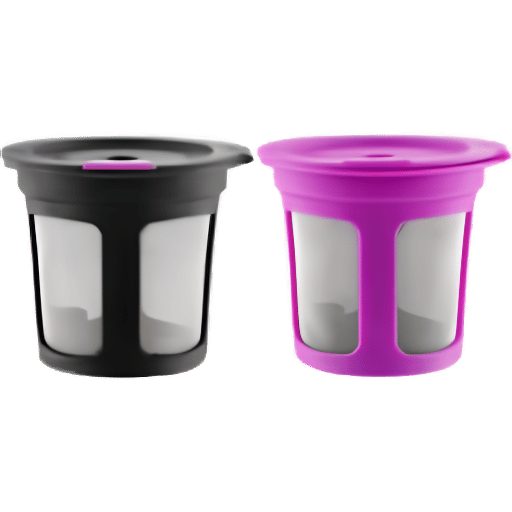
Each K-cup pack has four purchasable parts, with individual MOQ price curves, and bulk price reductions on large volume purchases of the final components reduced total material COGS by 25-40% relative to the small-run versions.
| Component | < 10K units | 100K units | 500K+ units |
|---|---|---|---|
| PP/EVOH cup shell | $0.050–$0.065 | $0.035–$0.047 | $0.030–$0.040 |
| Aluminum foil lid (1.0 mil) | $0.012–$0.015 | $0.010–$0.012 | $0.0097–$0.010 |
| Non-woven paper filter | $0.008–$0.012 | $0.006–$0.009 | $0.005–$0.007 |
| Coffee fill (10g commercial blend) | $0.055–$0.080 | $0.050–$0.075 | $0.045–$0.070 |
| Total materials | $0.125–$0.172 | $0.101–$0.143 | $0.090–$0.127 |
Coffee fills 40-65% of total material cost depending on grade. Commercial blends usages above assume $2.00 – $3.50/lb arabica (Spot prices in February 2025 averaged over $4.30/lb, which adds roughly $0.020-$0.040/cup to fill costs on brands without long term supply contracts).
📐 Engineering Note — Cup Shell Specifications
Standard K-cup shells use 7-layer polypropylene/EVOH co-extrusion. PP is the structural material, EVOH is the oxygen barrier layer. Both must meet the FDA 21 CFR 177.1520 compliance thresholds for food-contact PP. Shell oxygen transmission must meet ASTM D3985 standards if demonstrating a 12-month shelf-life.
Switching over to a PLA biodegradable shell adds $0.04-$0.10/cup relative to chemical MOQs. A handful of US states are now passing EPR legislation on single use-packaging and compostable shells will qualify for exemption in the vast majority of cases; this could be justification enough for premium brands.
Machine Investment and Per-Cup Depreciation — The Most Misunderstood Cost
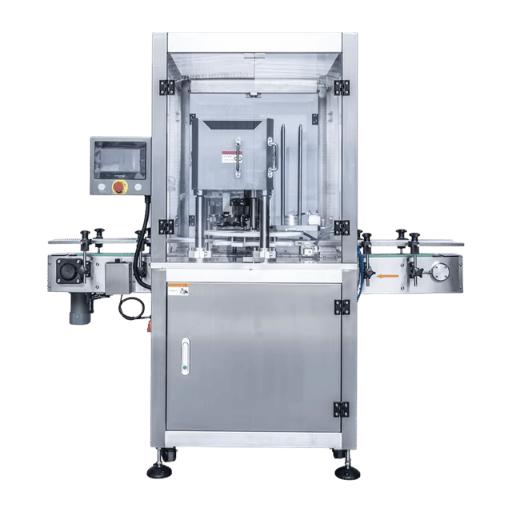
Most prospective buyers focus on the sticker price of a K-cup filling machine. The more relevant question in many cases is: what is the unit cost of that machine? That always seems to be lower than you might expect—which means the real machine cost hurdle is not depreciation itself; it’s the capital outlay.
| Machine Type | Price Range | Capacity (CPM) | Daily Output (8 hr) | Depreciation/Cup* |
|---|---|---|---|---|
| Manual / tabletop sealer | $5K–$20K | 5–15 CPM | 2,400–7,200 | $0.024–$0.080 |
| Semi-auto linear | $20K–$50K | 40–80 CPM | 19,200–38,400 | $0.008–$0.022 |
| Fully auto linear | $50K–$120K | 80–200 CPM | 38,400–96,000 | $0.005–$0.015 |
| High-speed rotary | $120K–$300K | 200–600 CPM | 96,000–288,000 | $0.002–$0.007 |
| Full industrial line | $500K–$1M+ | 600+ CPM | 288,000+ | $0.001–$0.003 |
*Depreciation was calculated based on typical operating volume for the given class of filling machine, a 5-7 year depreciation schedule, and 250 production days/year.
Depreciation formula: Machine Cost ÷ (Annual Production Days × Daily Output × Lifespan in Years). Worked example: a $60,000 fully automatic linear machine, 7-year life, running 3,000 cups per day × 250 days per year = $60,000 ÷ 5,250,000 = $0.011 per cup. Less than the cost of the aluminum lid.
💡 Counter-Intuitive Finding
In practice, a mid-range European or US domestic filling machine at the appropriate volume intake rarely costs more than $0.011-$0.025/cup depreciation; total machine cost is no more than coffee fill at those peaks. What most small brands are truly terrified by isn’t the cup-by-cup machine costs—it’s being handed a large-bill $45,000-$120,000 prior to launching the first sellable pod. Clarifying the distinction between these two concerns makes significant progress towards understanding the true risk.
Is a K-cup filling machine worth the investment for a small roaster?
At 1,000+ cups/day—assuming a constant order book—an in-house operation will show payback — and a positive ROI — in 12–24 months versus continuing to co-pack. For small-business K-cup operations specifically, the only factor that weighs in is not the machine cost/cup, but rather: is your monthly sales enough of a regular dose you can really afford the capex?
At 2000 cups/day, at a $45,000 120 CPM machine operating at 8 hours/day, it’s under 18 months vs. a $0.24/cup co-pack pricing. Anything under 500 cups/day will almost always work out financially better with co-pack.
Labor, Utilities, and Overhead — The Costs Most Brands Underestimate
Material and machine depreciation get budgeted. These four lines often don’t – and they total $0.025-$0.085 per cup that is not included in the first quarterly reconciliation.
- “1-2 line operators per run. At 200 CPM (12,000 cups/hr), $18/hr per operator adds just $0.0015/cup. At 40 CPM (2,400/hr), 2 operators adds a $0.015/cup- just in labor cost per cup it is 10 times more expensive to run slow machinery.Many mid scale brands, this calculation alone makes it worth for a faster line.
- $0.001-$0.003/cup in electricity at $0.12/kWh commercial rates – K-cup fillers consume about 3-7 kWh per hour in power, the variation coming from sealing temperature, auger motor load, and conveyance speed. Not much on its own, but significant combined.
- $0.002-$0.004/cup for nitrogen delivered. N on-site generators will reduce that charge by 90%, Payback on the generator itself is 12-14 months. Skip the N flush, shelf life stays 12+months and drops to less than 6 weeks- this is a non-negotiable for any retail distribution channel.
- Sealing film, spare die sets, filter media and scheduled preventive maintenance amounts to around $0.003-$0.008/cup when annualized. Accurate dosing calibration also minimizes the variance on coffee fill for the shop, defending quality and costs/cup.
Reject rate – where the majority of brands understate costs. Each unsealed (or rejected) pod is taken out of your Cost of Goods Sold denominator and therefore makes each good pod more costly:
| Cost Component | 1,000/day | 10,000/day | 50,000/day |
|---|---|---|---|
| Cup + lid + filter (materials) | $0.068–$0.092 | $0.051–$0.068 | $0.043–$0.057 |
| Coffee fill (commercial blend) | $0.055–$0.075 | $0.050–$0.070 | $0.045–$0.065 |
| Machine depreciation | $0.018–$0.040 | $0.005–$0.012 | $0.002–$0.005 |
| Labor (operator wages) | $0.018–$0.040 | $0.008–$0.018 | $0.003–$0.008 |
| Utilities + N₂ gas | $0.004–$0.007 | $0.003–$0.006 | $0.002–$0.004 |
| Reject rate uplift (3%) | $0.005–$0.008 | $0.004–$0.007 | $0.003–$0.005 |
| Full COGS / good cup | $0.168–$0.262 | $0.121–$0.181 | $0.098–$0.144 |
Commercial blend coffee assumed $2.50-$3.50/lb. Specialty beans are $0.10-$0.25 added to coffee fill row.
📋 Scenario: The Reject Rate Gap
Midwest roaster using a 100 CPM machine for 8 hrs/day had calculated their COGS at $0.192/cup. Their math included materials, machine depreciation and labor. During an annual cost audit they found a 4% reject they had not planned for.
That 4% loss on $0.192 raw COGS added $0.008/cup of sellable product—making real COGS $0.200. That’s $5,840/yr in untracked waste on 2000 cups/day. over 7-year machine life: $40,880. The solution was a sealing die tweak down to under 1% rejects.
How Production Volume Changes Your Unit Cost [The 20,000/Day Rule]
![How Production Volume Changes Your Unit Cost [The 20,000/Day Rule]](https://afpakmachine.com/wp-content/uploads/2026/05/5-7.png)
K-cup manufacturing cost doesn’t decline proportionally with volume — scale economics here follow a step-function pattern. As volume increases, costs decline in tiers. These tiers are based on whether or not the machine class has changed, if the bulk pricing tier has changed, or if the labor devoted to it has increased.
Knowing where you stand on this unassuming grade is the starting point for any honest decision making around investment. For equipment investments, whether it is worth it or not, depends nearly entirely on which tier you are in and how fast you grow through it.
| Volume Tier | Materials | Machine Dep. | Labor | Overhead | Est. Total COGS |
|---|---|---|---|---|---|
| 500/day (startup) | $0.130–$0.200 | $0.025–$0.065 | $0.030–$0.060 | $0.010–$0.015 | $0.195–$0.340 |
| 2,000/day | $0.108–$0.165 | $0.012–$0.028 | $0.018–$0.035 | $0.007–$0.012 | $0.145–$0.240 |
| 5,000/day | $0.098–$0.155 | $0.006–$0.014 | $0.012–$0.025 | $0.005–$0.008 | $0.121–$0.202 |
| 20,000/day | $0.088–$0.135 | $0.003–$0.008 | $0.007–$0.015 | $0.003–$0.006 | $0.101–$0.164 |
| 50,000+/day | $0.078–$0.125 | $0.002–$0.005 | $0.004–$0.010 | $0.002–$0.004 | $0.086–$0.144 |
Assumes SM blends, no premium beans on another line. Specialities added $0.09-$0.25 to Materials at all 3 levels.
🏆 The 20,000/Day Rule
Based on documented economics of production in K-Cup segment; if you cannot define a reliable in-house unit cost that is $0.15-$0.25 below typical co-packing costs (per cup), then co-packing will almost always be less expensive per unit on paper until you reach the right volume (the question is whether your growth rate can support the capital to get there).
Decision rule: If less than 5000/day, evaluate co-packing first. If between 5,000-20,000/day run the dual track analysis (initiate co-pack negotiations + model machine investment against growth). If greater than 20,000/day, in-house almost always wins on unit economics — ROI on equipment typically clears in under 24 months at this tier.
In-House Production vs. Co-Packing — A Full Cost Comparison
In-house scale economics begin to break-even with co-packing economics in the 20,000-50,000/day range from documented production economics of K-Cups.
| Decision Dimension | Co-Packing Route | In-House Production |
|---|---|---|
| Unit cost range | $0.15–$0.35/cup | $0.10–$0.22/cup (at scale) |
| Upfront capital | $5K–$15K (materials + MOQ) | $15K–$300K+ (machine + setup) |
| Minimum run size | 5,000–50,000 pods/SKU | No minimum (your machine) |
| Lead time | 4–8 weeks after artwork approval | Same-day to 48 hours |
| Recipe / IP control | Lower — co-manufacturer handles process | Full — your floor, your formula |
| Quality control ownership | Co-packer’s QC system | Your QC protocols |
| Scalability ceiling | Easy — order more runs | Machine capacity ceiling (requires filling machine upgrade) |
| Cost structure | 100% variable — no fixed exposure | Mixed fixed + variable |
The path to market through co-packing may be the right first step. It can remove the capital decision, help you grow to store out of your garage, and confirm demand before making equipment commitment. The trade-off is the built-in per cup cost premium which can add up to a lot of money at scale.
Co-Packing costs-to-be-watched include fees for setup (~$300-$1,500 per run), reformulation constraints (single origin or non-standard grind size options may be unavailable), scheduling pressures during peak planning seasons, and minimum run penalties if your needs don’t meet their minimums. Some co-packers raise their prices on less than 90 days notice, be sure to research your K-cup co-packing partner thoroughly before settling on their contract terms.
Hidden costs of in-house production: The operator training curve runs 4–8 weeks at 15–25% below nameplate capacity on a new machine. Add scheduled preventive maintenance downtime, and working capital tied to raw material inventory. Neither cancels the economics at scale — but both affect cash flow in year one.
📋 Scenario: The Machine Payback Calculation
A specialty roaster in the Pacific Northwest was co-packing 2,200 cups/day at $0.24/cup, spending $132,000 annually. They evaluated a $45,000 fully automatic linear machine (120 CPM, 7-year life). Running the numbers: annual materials $90,200, machine depreciation $5,143, labor $19,800 (1 operator × $18/hr × 8hr × 250 days), overhead $4,400 — total in-house COGS $119,543, or $0.217/cup. Against $0.240 co-packing: net saving of $0.023/cup × 550,000 annual cups = $12,650/year. Machine payback: 3.6 years. They chose in-house primarily for recipe control — but the economics worked independently.
What is the minimum production volume that makes private label K-cup manufacturing worth it?
Building Your Profit Margin — From Production Cost to Retail Pricing
At less than 500 cups/day, co-packing delivers lower unit costs on every metric – stick with a co-manufacturer. At more than 500- 5,000 cups/day, in-house can be justified if you consider machine investment, bean grade and anticipated growth rates – run the depreciation and ROI computation expressly. At more than 5,000- 10,000cups/day, in-house can be justified by the substantial difference in unit cost (especially if you need recipe protection or shorter lead times).
The co-packing cost of goods is only half the profit margin equation. Channel structure is the other margin component — specifically, “what am I left with after it goes through the distribution channel to make it to the bank?”
Average consumer K-cups sell for $0.50-$1.00+ per pod online, grocery, and club. The range conveys little information about the price paid to the producer. Distributor and broker margins typically eat 30-40% of retail before money reaches the brand, so an MSRP of $0.70 per pod delivers $0.42-$0.49 to the brand bottom line net of distribution.
| Scenario | COGS/Cup | Retail Price | Brand Net (post-distrib.) | Brand Gross Margin |
|---|---|---|---|---|
| Value brand (commercial blend) | $0.14 | $0.55 | $0.36 | 61% |
| Specialty roaster (premium beans) | $0.25 | $1.00 | $0.65 | 62% |
| Private label (direct to retailer) | $0.18 | $0.38 (wholesale) | $0.38 (no middleman) | 53% |
⚠ The Distribution Margin Trap
Pricing is the biggest sales-killer in the K-cup space: brands peg gross margins on retail price and ignore how broker/distributor margins eat 30-40cents of every retail dollar. A brand expecting 74% gross margin on a $1.00 pod is technically getting $0.65 after distributor take – which, on a $0.25 COGS, yields a 62% profit margin rather than the 74% the margins imply. Think about your pricing and COGS targets based on what the brand is actually getting paid, not the retail shelf price.
2025 Cost Trends — Tariffs, Sustainability, and the Outlook for K-Cup Producers
There are three simultaneous factors increasing costs for K-cup manufacturing in 2025. Understanding these forces in their separation can reveal where hedging is available, and where costs are structural.
Arabica price explosion: In February 2025, the arabica C-price crossed $4.30/lb for the first time since the late 70s. Compared to the first weeks of 2024 it has increased 79%. This acceleration comes from consecutive shortfalls in Brazil, mirroring previous shocks in 1990s, and speculators, blowing up future prices in the paper market. At $4.30/lb 10 g of arabica bean costs us approximately $0.095 per cup of brew, almost two times more expensive than back in 2024 before the markets gained this 79% premium. Brands that pursue the instant purchase path on the spot market will be taking the biggest variable cost hit at any volume for a while.
“Roasters that continue to hold off hoping for the market to crash may find themselves either without coffee when they need it most or forced to buy at even higher prices.”
— Adam Pesce, President, Reunion Coffee Roasters, via Perfect Daily Grind, February 2025
Aluminum tariff (March 2025): On 12 March, 2025 the US government increased the tariff on all imported steel and aluminum to 25%, rolling back the previous temporary tariff exemptions. Aluminum foil lids account for approximately 12–15% of K-cup material costs. A 25% tariff on the aluminum content works out around $0.002-$0.004 per cup increased cost for brands that continue to buy from the affected origins. For a brand producing two million capsules a month, that is $4k-$8k each month in added material costs. Usually firms buy aluminum domestically, but this comes at a cost premium due to the quality. AFPAK’s full tariff impact analysis covers sourcing strategies in detail.
Compostable capsule premium: Cellulosic shells made of PBAT and PLA carry a $0.04-$0.10/cup premium over standard polypropylene shells for the same MOQ. Currently five Eastern US states enforce Extended Producer Responsibility regulation sometimes called EPR, which regulation covers capsule single-use packaging. Though the compostable market share is currently less than 8% of total K-cup volume, brands that move into Food-service and premium segments are frequently required to substantiate certification etc. The unit premium decreases as volumes rise to 500K+/month and copmosable raw material supply chain stabilizes.
Automation as partial offset: Despite materials inflation pressures, higher speed machines are often more affordable than 3 years ago. And, mid-range rotary machines ($120K-$200K) that historically required an 18-24 month payback are now providing 6-12 month IRRs at steady state commercial volumes, offsetting a measurable portion of the per-cup impact of materials inflation via labor reduction.
Outlook: COGS pressure is up through 2026. The key responses are: isolate green coffee prices in supply contracts, consider domestic aluminum lid sourcing for tariff buffering, and crunch the depreciation table for capacity expansion now, in advance of the next volume target.
Frequently Asked Questions
About This Analysis
AFPAK offers K-cup filler/sealers in 40-600+ CPM range. Cost reference information is compiled from publicly available commodity prices (FRED arabica price index), regulatory standards (FDA 21 CFR 177.1520), equipment industry benchmarks, service provider disclosures, and trade publication industry data. Pricing is presented as a range. Actual unit COGS is subject to custom sourcing plan, bean grade, machine utilization and facility factor. All values are quoted with qualifications explicitly made. For specific depreciation estimates per volume output, please consult AFPAK directly.
Related Resources
- K-cup co-packaging companies and service rates — a buyer’s guide
- Maintenance costs for K-cup filling equipment — what to budget annually
- Sustainable and biodegradable K-cup options: cost vs. compliance tradeoffs
- Complete guide to coffee capsule filling machines: types, specs, and selection criteria
- Nespresso vs. K-Cup: relative economics for your coffee brand manufacturing plan